TREES by 2l Forge
Working easily with structures
The app allows you to display, edit, and evaluate data structures in a transparent and clear manner. It also enables the aggregation of subordinate data at individual hierarchy levels. Maintain an overview at all times and focus your attention on the information that is actually relevant to the structure!
In many cases, data in PPM tools forms hierarchical structures. Projects belong to portfolios, resources are assigned to departments, and products are clustered into categories.
With TREES, these hierarchies can be visualized, edited, and evaluated. Thanks to its high flexibility, this generic widget can be used for a wide variety of applications.
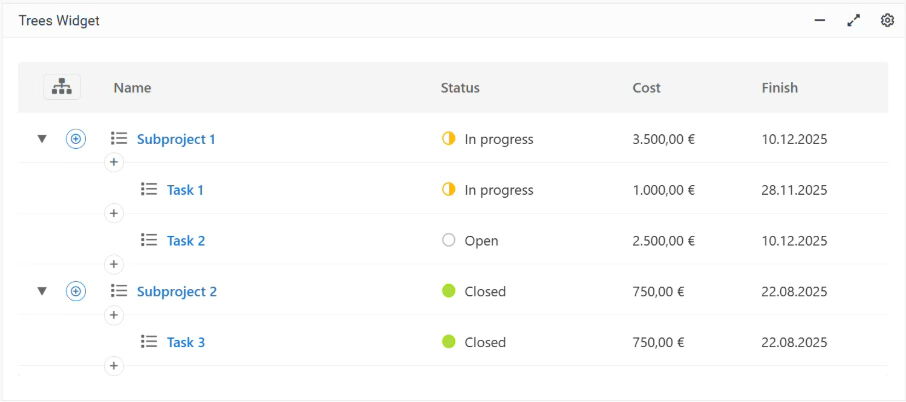
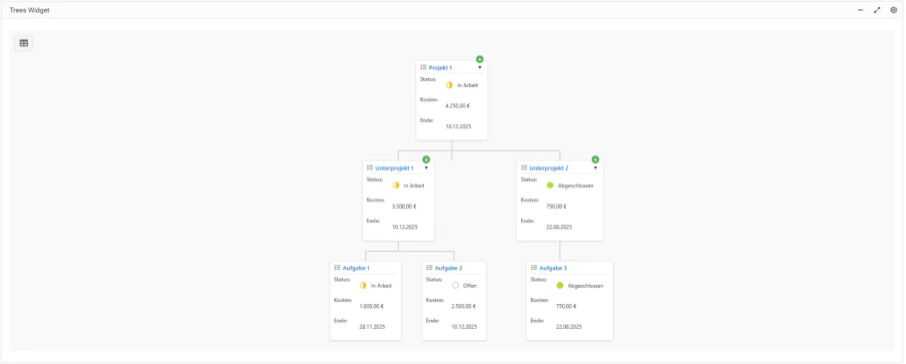
In TREES, dependencies can be displayed in two ways. By default, the data is output as a structured list, which clearly shows the structure through indentations and an ID. Another option is to display the hierarchy as a tree diagram, which provides a more suitable overview depending on the application.
The structures can not only be displayed together with attribute columns but also edited directly. Add new pages or move them easily within the overall structure using drag & drop. If this is not desired for individual elements, you can also lock them for editing within the widget.
TREES allows you to configure the aggregation of numerical and date values for subordinate elements at all levels. You can output sums and averages (for numerical values) as well as minimum and maximum values. These aggregations are not only visible in the widget but are also stored as attribute values on the respective page and can therefore be displayed in other locations.